Google Analytics Report for Example.com

Prepared by Scott Winn
Reading the Report
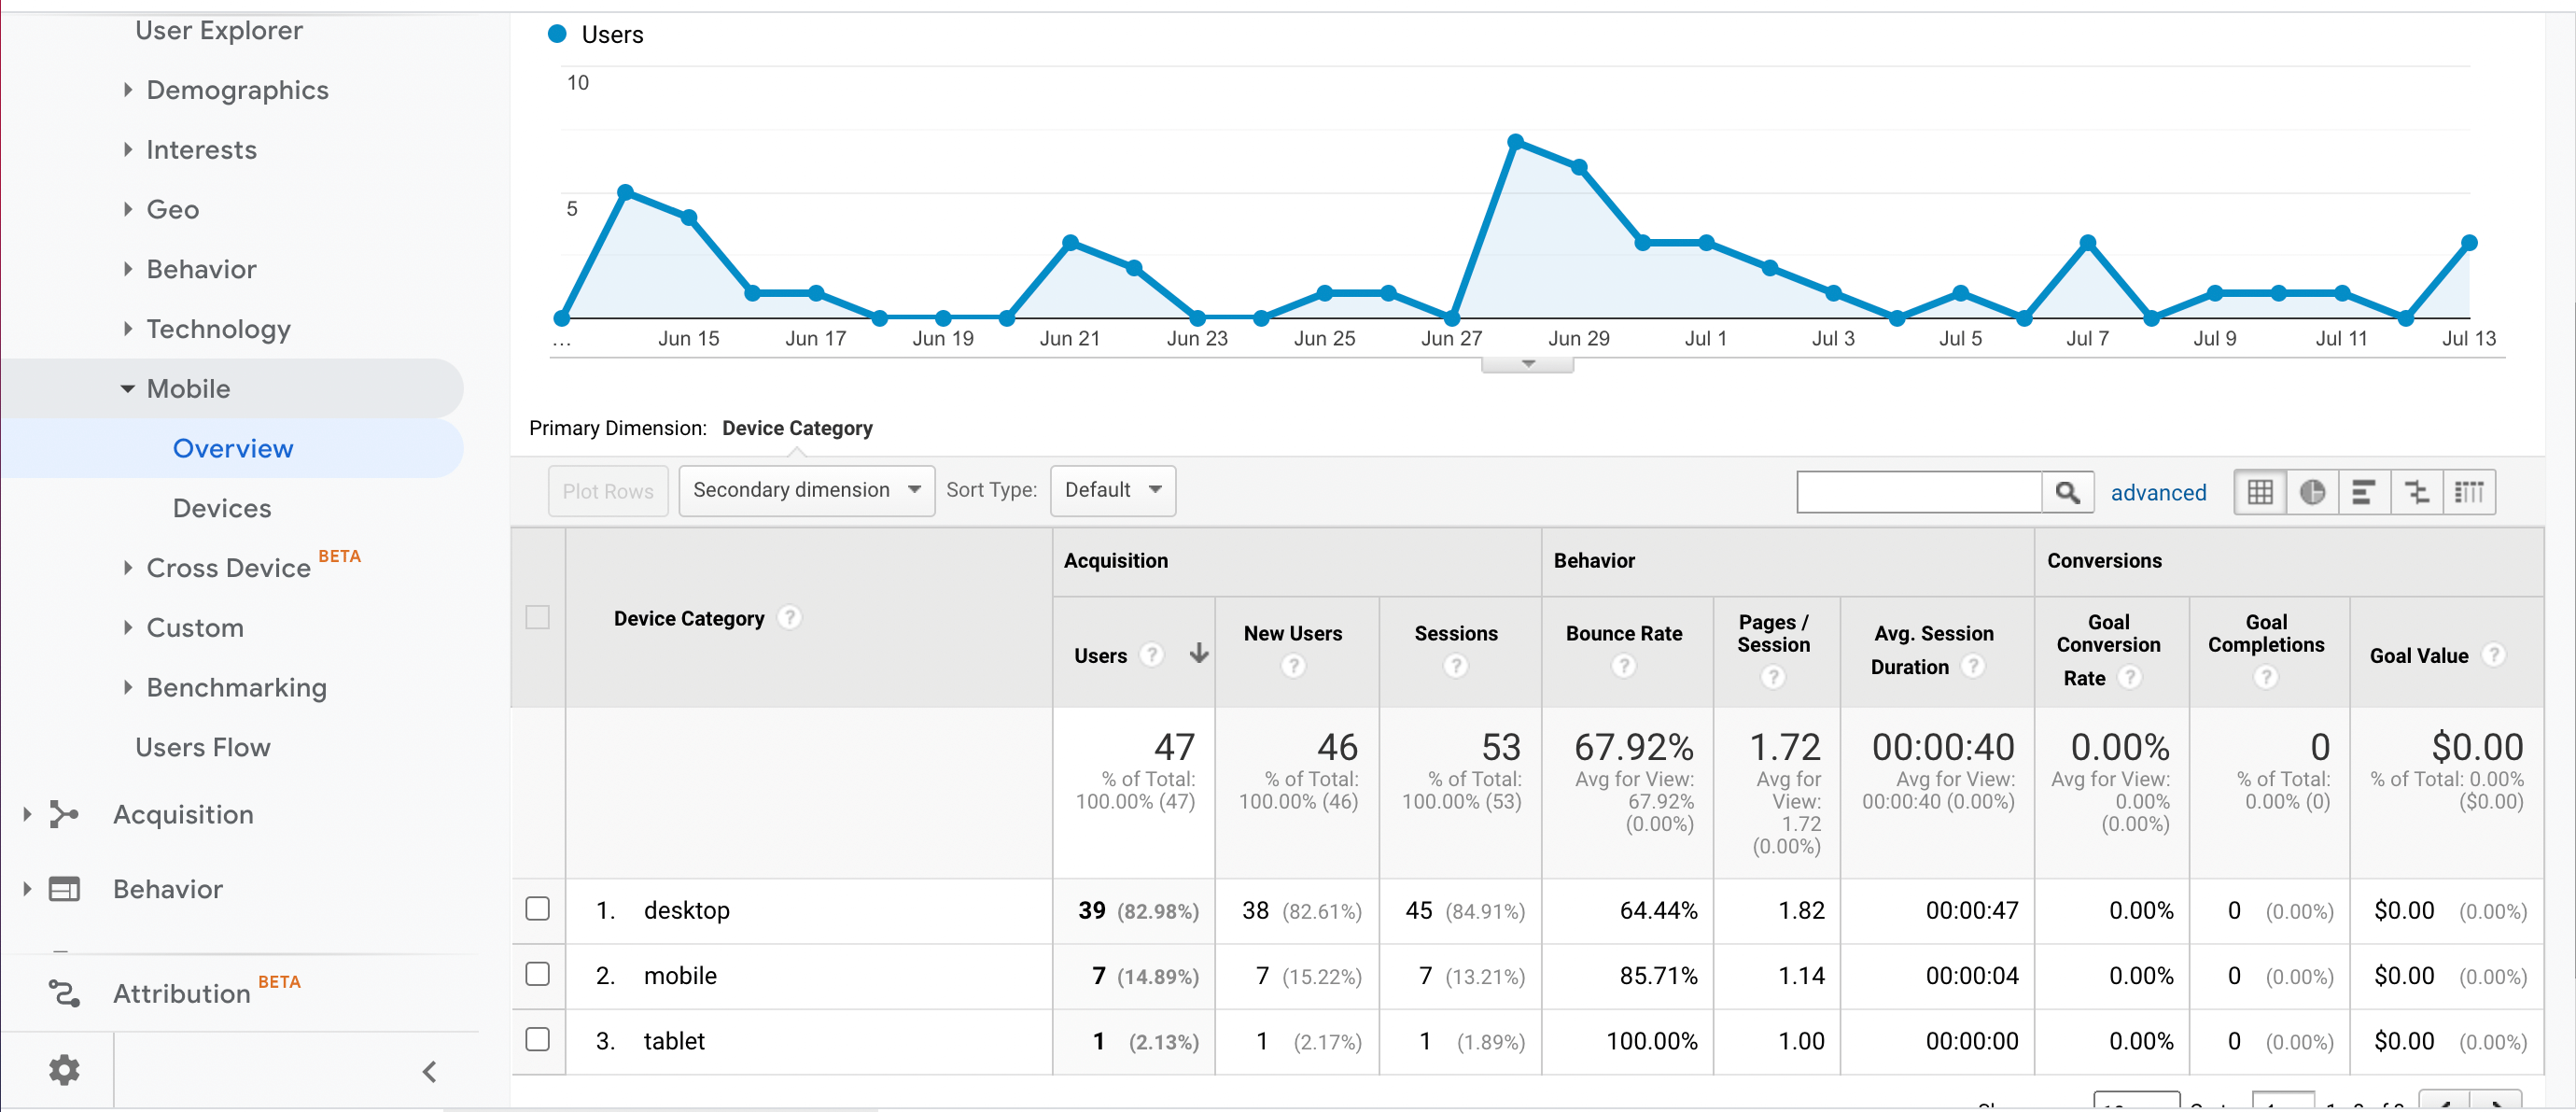
The Mobile App Overview shows us all user sessions (or visits) broken down into 3 broad device categories: desktop, tablet, and mobile. Each device category is shown on a row along with numbers that correspond to the column headings above. Each column represents a unique metric, and in this report those metrics are divided into 3 groups: Acquisition, Behavior, and Conversions
Making Sense of the Numbers
The Acquisitions group displays the number of users, new users, and sessions. From this report we can easily see that most of the users are on a desktop device (including laptops) and that these users represent most sessions. If we look at the desktop row and compare the number of users to the number of sessions, we notice that some of these users returned to the site, as opposed the mobile and tablet users who did not.
The Behavior group shows high-level information about the sessions, how long the user was on the site and how many pages were visited. The bounce rate represents the percentage of sessions that only had one page view. This means the user left the site without visiting any other sections. As we can see there is a very high bounce rate for both tablet and mobile users. Pages per session shows the average number of pages the user viewed. Along with that Average session Duration tells us how long users generally spend on the website. Based on these 3 metrics it can be inferred that most users are quickly scanning a single page, clicking on one link at most, before leaving the site.
The Conversions group tracks user activity on the site and gives a corresponding value. Based on this information either no users completed any goals, or the organization has not set any session goals. We should consult the sales and marketing teams to determine which website actions might create value that can be tracked by this report.
Reporting Device Details
While the Mobile Overview can shed some important insight, it does not reveal which operating system the user is on. From the Mobile Devices report we can see which phone or tablet was user and make a guess as to which operating system is installed. However, if we look under the Technology group, we will see a Browser & Operating System Report. This report tracks the same metrics as the Mobile Overview, but it is broken down by operating system instead of device. This report shows that most visitors are using Chrome (56%), with Microsoft Edge coming in second (19%).
Better Reporting
In addition to checking other reports, more insight might be gained by considering a longer reporting session, perhaps 90 days. Due to the low volume of traffic shown in this report it is difficult to determine any trends. We can see that the traffic is following a weekly pattern where we see a spike of activity one day which tapers off over the course of the week. However, I believe that a 90-day report will give us a better idea of our current traffic trends, allowing us to forecast and make improvements toward retaining users.